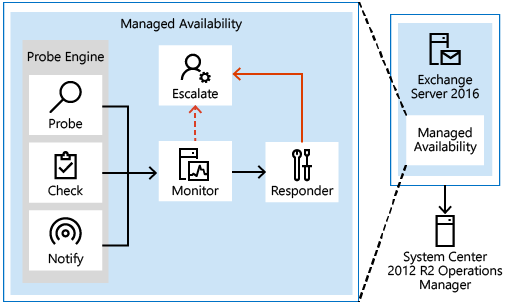
Managed Availability Components
Probes
The first component is called a Probe. Probes are responsible for taking measurements on the server and collecting data.
There are three primary categories of probes: recurrent probes, notifications, and checks. Recurrent probes are synthetic transactions performed by the system to test the end-to-end user experience. Checks are the infrastructure that perform the collection of performance data, including user traffic. Checks also measure the collected data against thresholds that are set to determine spikes in user failures, which enable the checks infrastructure to become aware when users are experiencing issues. Finally, the notification logic enables the system to take action immediately, based on a critical event, and without having to wait for the results of the data collected by a probe. These are typically exceptions or conditions that can be detected and recognized without a large sample set.
Recurrent probes run every few minutes and evaluate some aspect of service health. These probes might transmit an email via Exchange ActiveSync to a monitoring mailbox, they might connect to an RPC endpoint, or they might verify Client Access-to-Mailbox connectivity.
All probes are defined on Health Manager service startup in the Microsoft.Exchange.ActiveMonitoringProbeDefinition crimson channel. Each probe definitions has many properties, but the most relevant properties are:
- Name The name of the probe, which begins with a SampleMask of the probe’s monitor.
- TypeName The code object type of the probe that contains the probe’s logic.
- ServiceName The name of the health set that contains this probe.
- TargetResource The object the probe is validating. This is appended to the name of the probe when it is executed to become a probe result ResultName
- RecurrenceIntervalSeconds How often the probe executes.
- TimeoutSeconds How long the probe will wait before failing.
There are hundreds of recurrent probes. Many of these probes are per-database, so as the number of databases increases, so does the number of probes. Most probes are defined in code and are therefore not directly discoverable.
The basics of a recurrent probe are as follows: start every RecurrenceIntervalSeconds and check (or probe) some aspect of health. If the component is healthy, the probe passes and writes an informational event to the Microsoft.Exchange.ActiveMonitoringProbeResult channel with a ResultType of 3. If the check fails or times out, the probe fails and writes an error event to the same channel. A ResultType of 4 means the check failed and a ResultType of 1 means that it timed out. Many probes will re-run if they timeout, up to the value of the MaxRetryAttempts property.
Note
The ProbeResult crimson channel can get very busy with hundreds of probes running every few minutes and logging an event, so there can be a real impact on the performance of your Exchange server if you try expensive queries against the event logs in a production environment.
Notifications are probes that are not run by the health manager framework, but by some other service on the server. These services perform their own monitoring, and then feed their data into the Managed Availability framework by directly writing probe results. You won’t see these probes in the ProbeDefinition channel, as this channel only describes probes that will be run by the Managed Availability framework. For example, the ServerOneCopyMonitor Monitor is triggered by probe results written by the MSExchangeDAGMgmt service. This service performs its own monitoring, determines whether there is a problem, and logs a probe result. Most notification probes have the capability to log both a red event that turns the monitor unhealthy and a green event that makes the monitor healthy again.
Checks are probes that only log events when a performance counter passes above or below a defined threshold. They are really a special case of notification probes, as there is a service monitoring the performance counters on the server and logging events to the ProbeResult channel when the configured threshold is met.
To find the counter and threshold that is considered unhealthy, you can look at the monitor for this check. Monitors of the type Microsoft.Office.Datacenter.ActiveMonitoring.OverallConsecutiveSampleValueAboveThresholdMonitor or Microsoft.Office.Datacenter.ActiveMonitoring.OverallConsecutiveSampleValueBelowThresholdMonitor mean that the probe they watch is a check probe
Monitor
The results of the measurements collected by probes flow into the second component, the Monitor. The monitor contains all of the business logic used by the system on the data collected. Similar to a pattern recognition engine, the monitor looks for the various different patterns on all the collected measurements, and then it decides whether something is considered healthy.
Monitors query the data to determine if action needs to be taken based on a predefined rule set. Depending on the rule or the nature of the issue, a monitor can either initiate a responder or escalate the issue to a human via an event log entry. In addition, monitors define how much time after a failure that a responder is executed, as well as the workflow of the recovery action. Monitors have various states. From a system state perspective, monitors have two states:
- Healthy: The monitor is operating properly and all collected metrics are within normal operating parameters.
- Unhealthy: The monitor isn’t healthy and has either initiated recovery through a responder or notified an administrator through escalation.
From an administrative perspective, monitors have additional states that appear in the Exchange Management Shell:
- Degraded: When a monitor is in an unhealthy state from 0 through 60 seconds, it’s considered Degraded. If a monitor is unhealthy for more than 60 seconds, it is considered Unhealthy.
- Disabled: The monitor has been explicitly disabled by an administrator.
- Unavailable: The Exchange Health service periodically queries each monitor for its state. If it doesn’t get a response to the query, the monitor state becomes Unavailable.
- Repairing: An administrator sets the Repairing state to indicate to the system that corrective action is in the process by a human, which allows the system and humans to differentiate between other failures that may occur at the same time corrective action is being taken (such as a database copy reseed operation).
Every monitor has a SampleMask property in its definition. As the monitor executes, it looks for events in the ProbeResult channel that have a ResultName that matches the monitor’s SampleMask. These events could be from recurrent probes, notifications, or checks. If the monitor’s thresholds are achieved, it becomes Unhealthy. From the monitor’s perspective, all three probe types are the same as they each log to the ProbeResult channel.
It is worth noting that a single probe failure does not necessarily indicate that something is wrong with the server. It is the design of monitors to correctly identify when there is a real problem that needs fixing. This is why many monitors have thresholds of multiple probe failures before becoming Unhealthy. Even then, many of these problems can be fixed automatically by responders, so the best place to look for problems that require manual intervention is in Microsoft.Exchange.ManagedAvailabilityMonitoring crimson channel. This will include the most recent probe error.
Responders
Finally, there are Responders, which are responsible for recovery and escalation actions. As their name implies, responders execute some sort of response to an alert that was generated by a monitor. When something is unhealthy, the first action is to attempt to recover that component. This could include multi-stage recovery actions; for example, the first attempt may be to restart the application pool, the second may be to restart the service, the third attempt may be to restart the server, and the subsequent attempt may be to take the server offline so that it no longer accepts traffic. If the recovery actions are unsuccessful, the system escalates the issue to a human through event log notifications.
Responders take a variety of recovery actions, such as resetting an application worker pool or restarting a server. There are several types of responders:
- Restart Responder Terminates and restarts a service.
- Reset AppPool Responder Stops and restarts an application pool in Internet Information Services (IIS).
- Failover Responder Initiates a database or server failover.
- Bugcheck Responder Initiates a bug check of the server, thereby causing a server reboot.
- Offline Responder Takes a protocol on a server out of service (rejects client requests).
- Online Responder Places a protocol on a server back into production (accepts client requests).
- Escalate Responder Escalates the issue to an administrator via event logging.
In addition to the above-listed responders, some components also have specialized responders that are unique to their component.
All responders include throttling behavior, which provides a built-in sequencing mechanism for controlling responder actions. The throttling behavior is designed to ensure that the system isn’t compromised or made worse as a result of responder recovery actions. All responders are throttled in some fashion. When throttling occurs, the responder recovery action may be skipped or delayed, depending on the responder action. For example, when the Bugcheck Responder is throttled, its action is skipped, and not delayed.